

Linux is down slightly after a peak month, but probably that month had Linux over-represented. This month we see English down a bit too, Chinese is up a little.
https://store.steampowered.com/hwsurvey/Steam-Hardware-Software-Survey-Welcome-to-Steam
https://www.gamingonlinux.com/steam-tracker/
I copied the data from gamingonlinux and put it into my own sheet with an exponential trendline (red) and a moving average line (green) to smooth out the variance of the survey. We’re definitely trending upwards.
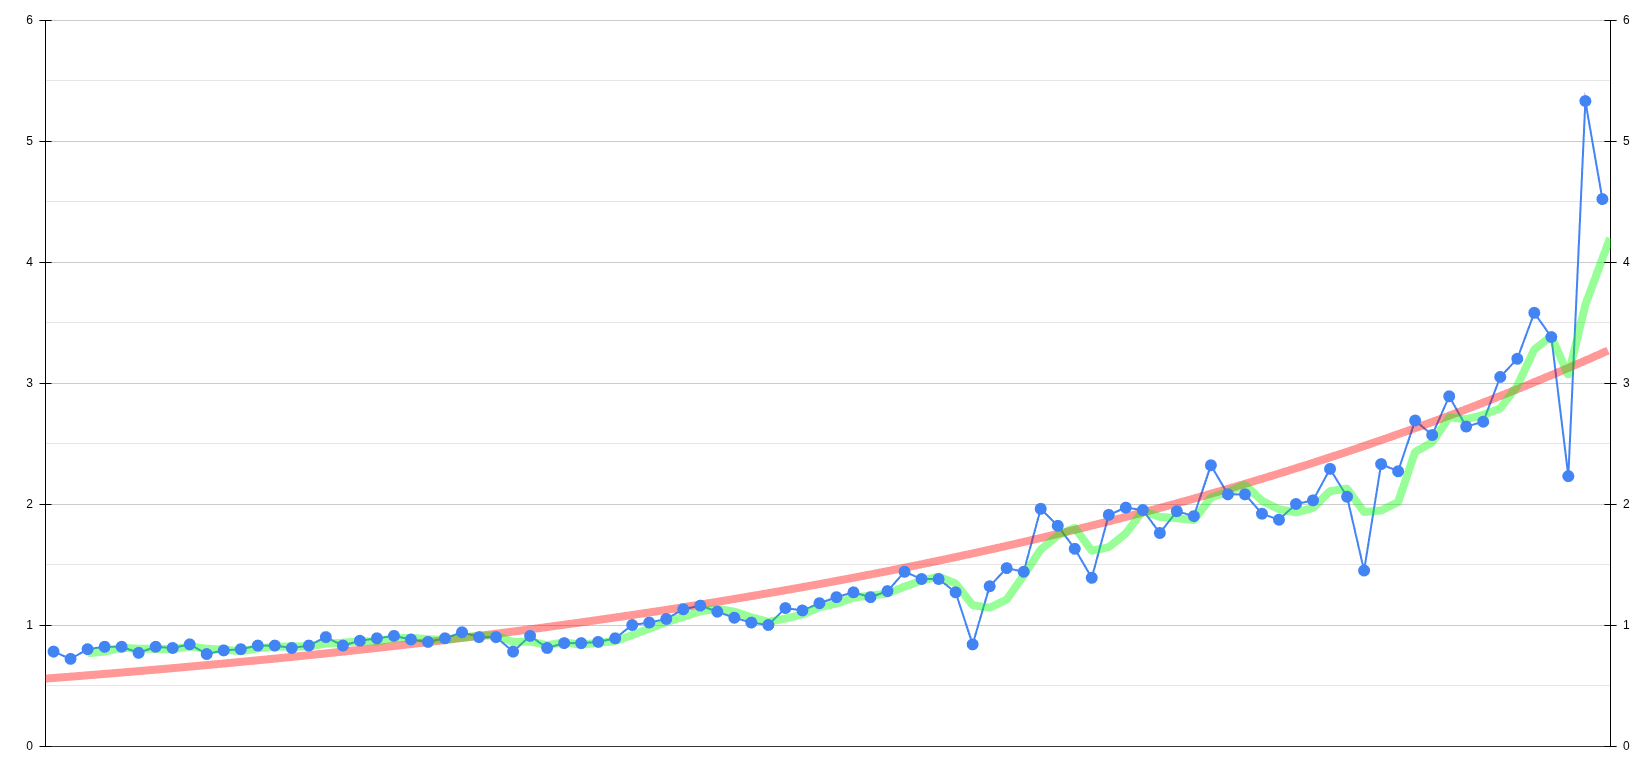
Here’s the csv data
0.78, 0.72, 0.80, 0.82, 0.82, 0.77, 0.82, 0.81, 0.84, 0.76, 0.79, 0.80, 0.83, 0.83, 0.81, 0.83, 0.90, 0.83, 0.87, 0.89, 0.91, 0.88, 0.86, 0.89, 0.94, 0.90, 0.90, 0.78, 0.91, 0.81, 0.85, 0.85, 0.86, 0.89, 1.00, 1.02, 1.05, 1.13, 1.16, 1.11, 1.06, 1.02, 1.00, 1.14, 1.12, 1.18, 1.23, 1.27, 1.23, 1.28, 1.44, 1.38, 1.38, 1.27, 0.84, 1.32, 1.47, 1.44, 1.96, 1.82, 1.63, 1.39, 1.91, 1.97, 1.95, 1.76, 1.94, 1.90, 2.32, 2.08, 2.08, 1.92, 1.87, 2.00, 2.03, 2.29, 2.06, 1.45, 2.33, 2.27, 2.69, 2.57, 2.89, 2.64, 2.68, 3.05, 3.20, 3.58, 3.38, 2.23, 5.33, 4.52
It seems that the lag period (pre-Steam Deck) is causing the exponential fit to not be that good. Can you try fitting only to data from the past 4 years to see if the fit is better?
Edit: Was easy enough for me to do, and I had the software to do it, so I did it.
Details:
The year of the GNU/Linux desktop!
When will it hit 100%?
I mean according to the data, 5 years and 9 months but also according to the data in 7 years it should reach 200% usage…
Woo can’t wait to hit 200%! I think that means everyone runs Linux and runs Steam inside Docker lol
Is that before or after Emperor Palpatine’s cameo in Rugrats?
Probably tanh or logistical fit is better, and we’re in the early exponential phase of it.
I considered it, but we’re so early in the exponential rise that I didn’t think it would matter significantly unless you really wanted to do some future extrapolation